The Collapse of Anchor

In our previous article, ‘Demystifying Anchor,’ posted on the 2nd of May, we explained how Anchor acted as a savings protocol that, using income derived from staked assets provided as collateral and interest from borrowings, was able to pay interest to UST deposit holders.
While the 19.45% advertised interest rate was unsustainable based on the ratio between depositors and borrowers, we expressed how a 4–5% yield paid to depositors could be feasible long term. The article further explored some of the risks inherent in depositing into the protocol, the most important being the risk of a potential de-peg of UST from its algorithmically derived $1 USD value, and investigated how the Luna Foundation Guard (‘LFG’) attempted to partially back UST through reserves of Bitcoin and Avax.
This piece represents a follow-up to ‘Demystifying Anchor,’ investigating what has happened to Anchor and the Terra ecosystem over the past month, what caused UST to drop from $1 to $0.05 and how over $40 billion of market value was destroyed in a death spiral.
To understand what has happened, we need to fundamentally understand the relationship between UST (‘Terra’) and LUNA. UST is a decentralised, scalable, and algorithmic stablecoin on the Terra blockchain network.
There was nearly $19 billion UST in existence and $2 billion in daily volume at its peak.
Unlike stablecoins such as Tether, UST was not backed by a reserve asset such as US dollars. Instead, an algorithmic incentive mechanism maintained its value. Users on Terra could burn $1 of LUNA to create 1 UST or burn 1 UST to redeem $1 worth of LUNA. Because of this relationship, whenever there were differences in the ratio between the two, arbitrageurs could profit. If the balance of UST-LUNA is 1.1–0.9, individuals can purchase $0.9 worth of LUNA, burn it and convert it to 1 UST, profiting $0.2. This arbitrage was supposed to restore the peg between the two assets eventually.
The problem with UST and all other algo-stablecoins are that whenever the price deviates significantly from the peg, investors panic, and all trust in the arbitrage-based algorithm dissipates quickly.
Let’s look at a timeline from January 2022 to today to understand what happened to cause fear to overtake UST.
- 9th of January: The Luna Foundation Guard (‘LFG’) is officially formed as a non-profit organisation dedicated to ‘build reserves supporting the UST peg amid volatile market conditions.
- 22nd of February: LFG raises $1 billion by selling LUNA to buy bitcoin to support the UST peg.
- 25th of March: Speculation on Twitter and other media platforms suggests that LFG purchased 2,840 BTC worth $125 million at the time.
- 28th of March: Do Kwon, the director of the LFG, confirms LFG’s bitcoin wallet address showing the foundation had purchased over 27,000 BTC worth $1.3 billion.
- 7th of April: LFG adds AVAX to its UST reserve, purchasing $100 million.
- 11th of April: LFG reaches its peak bitcoin reserve of 39,897 BTC. It was valued at $1.7 billion at the time.
- 19th of April: UST becomes the third-largest stablecoin.
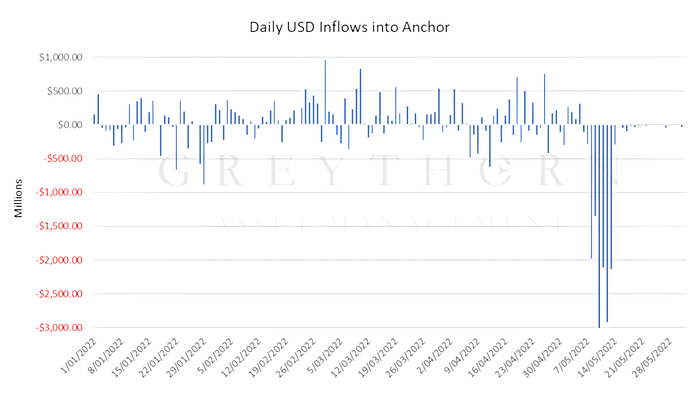
- 8th of May: Anchor’s total UST deposits fall from $14 billion to $11.2 billion. $150 million UST is withdrawn from liquidity pools on Curve (a DeFi platform used for swapping stablecoins) by Terraform labs in anticipation of the start of new liquidity pools (4pool). A single wallet sells $84 million UST on the Ethereum blockchain and $108 million on Binance. UST begins to de-peg, dropping to a low of $0.985.
- 9th of May: Deposits on Anchor continue to drop below $9 billion; UST loses its $1 peg for the second time, falling to as low as $0.35. The UST price will remain highly volatile in the coming days, rallying inter-day to highs of $0.9 before continuing to drop.
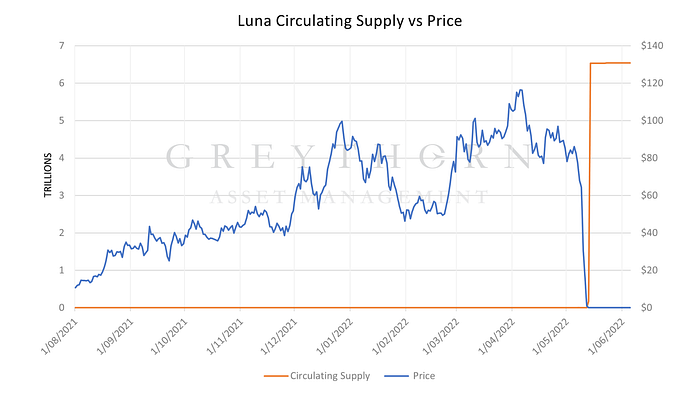
- 12th of May: The Terra blockchain is officially halted following sharp drops in the Luna price. Luna falls 96% in one day to less than $0.1. Hyperinflation of the Luna supply to support the UST peg results in a death spiral where more Luna is printed from existing UST, dropping the price of Luna, therefore, requiring more Luna to be minted.
- 16th of May: LFG confirms that it has depleted its entire BTC reserve in an attempt to support UST’s peg. Do Kwon proposes to fork Terra without UST and pledges to rebuild the whole project.
- 28th of May: The new Terra blockchain goes live. The old chain is rebranded as Terra classic.
- 31st of May: UST is valued at $0.02475 and Terra Classic (LUNC) at $0.0001209. From the 4th of February to the 31st of May 2022, the supply of LUNC increased from 3.5 billion to 6.9 trillion.
From May 8 to May 9, with significant outflows of UST from Anchor, an investor who wanted to cut their exposure to this situation had three courses of action:
- Use the algorithmic minting mechanism to burn 1 UST for $1 worth of LUNA
- Swap UST for another stablecoin using Curves 3CRV liquidity pool (which had $550M of liquidity)
- Deposit UST onto a centralised exchange and sell for another asset.
Concerning option 1, the reserves for the mechanism were capped at 300M per day out of the $2B in total reserves. As such, when many users attempted to activate the mechanism to realise the arbitrage opportunity, they found it impossible to do so.
Concerning option 2: In preparation for the launch of the 4CRV liquidity pool, the supply of alternative stablecoins in the 3 CRV pool was lower than usual. As a result, the pool could not absorb the sell volume, with UST becoming 95% of the pool. Billions of UST were therefore forced onto centralised exchanges to be sold.
This left option 3 as the only means by which investors could swap out of their UST positions. This situation led to massive selling pressure causing UST to significantly de-peg. While UST did experience significant intra-day liquidity (even rising to the low $0.9 mark), significant sell orders below the $1 peg led to UST being unable to recover its peg after May 9.
The actions of the LFG to attempt to build a reserve backing in Bitcoin also likely contributed to the widespread fear that occurred in cryptocurrency markets over this period.
The selling of the Bitcoin reserve from May 8–16 in support of the peg helped drive the BTC price to a low of $26,750 on May 12. This selling pressure had a double effect as the falling bitcoin price meant that LFG had fewer capital reserves to support the peg while also causing contagion throughout decentralised financial markets. Concerns over the safety of cross-chain bridges and other lending protocols led to a dramatic decrease in total value locked in Defi from $155 B on May 5 to $86 B by May 13.
Due to UST being unable to recover its peg, the algorithmic incentive mechanism resulted in hyperinflation of LUNA supply. Once investors lost trust in the mechanism, a mentality of fear dominated, after which it was virtually impossible to stop. *
Could this have been foreseeable?
When we look at the economics of the Terra ecosystem, there are some red flags that appear somewhat apparent in hindsight.
The first foreseeable risk is that of the dominance Anchor had over the entire Terra ecosystem and the unsustainably high APR it offered.
At its peak, Anchor had 72% of all UST deposited into its system and was the most important protocol to Terra by far.
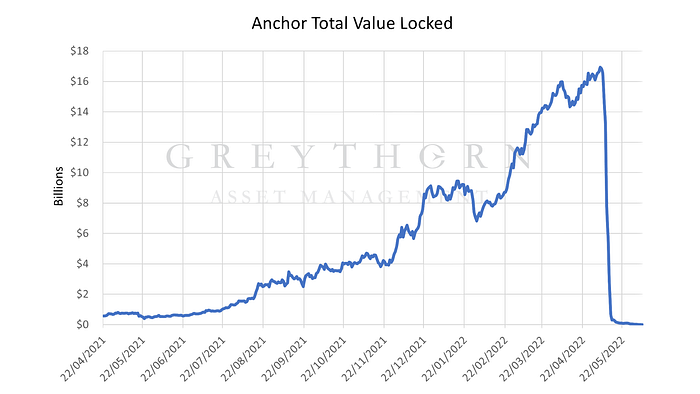
Lured by the prospect of a 19.45% interest rate, the total value locked in Anchor increased from $8.65 B in January 2022 to a peak of $17.15 B in May 2022, driving demand for UST far in excess of its potential use cases outside of Anchor.
The high returns of Anchor attracted individuals who were not believers in the future of the Terra ecosystem or UST’s use case in financial technology but simply people who wanted high returns for seemingly little risk.
This was exemplified by the fact that the borrowing on Anchor was not for any economically significant purpose, such as borrowing to finance a business, but was simply for speculation and to leverage returns.
The fact that individuals were rewarded with ANC tokens for borrowing UST and could turn around and reinvest said UST back into Anchor for greater returns is a clear example of the protocol’s ponzi-like mechanism.
In essence, “Because Anchor’s APY was so high, Anchor “actually sucked capital away from productive uses to be looped back into Anchor itself, so that parasitic capital could leverage its parasitism up multiple times instead of routing itself into other, differentiated use cases.”
Furthermore, the source of yield used to pay depositors on Anchor was a red flag. On the 28th of April 2022, $4.187 B of bLuna was locked into Anchor generating a staked return of 6.4% or $268 M for the protocol.
The income generated from bLuna was the second most significant source of revenue for the protocol, behind income from borrowing at $351 M. The fact that 39% of the income generated by Anchor derived from staked Luna is perplexing in hindsight as the payout to depositors was significantly sourced from Luna, the price of which was dependent on UST demand.
This concept is significant because no sustainable business has a core revenue stream solely dependent on constant financing and net capital inflows without generating actual economic value. The use case for borrowing on Anchor was never able to develop past speculation into real-world effects.
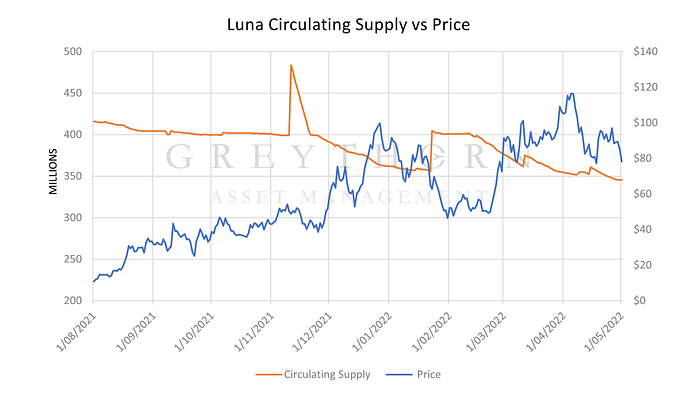
The relationship between Luna and UST was such that as demand for UST increased, the supply of Luna steadily decreased as Luna was burned for said UST. This reduction in Luna supply over time caused its price to increase from August 2021 until May 2021 somewhat steadily. Regressing these variables over this period shows a t-stat of -24 and a correlation coefficient of -0.82. This t-stat essentially means that the variable of Luna circulating supply is statistically significant in explaining the variance of Luna’s price action. The correlation of -0.82 means for every 1% decrease in the supply of Luna over this time period the price of Luna increased by 0.82%.
Anchor’s 20% yield caused demand for UST to explode over a short period of time. The demand for UST effectively pushed up the price of Luna through reducing its supply. This relationship had the inverse effect as demand for UST fell. Fear over the de-pegging of UST led to a bank run on Anchor and an increase in the supply of Luna causing its price to fall exponentially, thus making it more difficult to maintain the peg.
The second red flag was the question of the algorithmic stablecoin itself.
There are numerous examples of algorithmic stablecoins with very similar mechanisms to that of UST and LUNA in the past that have experienced a ‘death spiral’.
In early 2020, Basis Cash, using a similar ‘seigniorage algorithm’ to Terra’s, fell from its $1 peg to $0.3 in January 2021. Do Kwon was even one of the pseudonymous co-founders of basis cash.
Empty Set Dollar stablecoin was also launched in early 2020 with a seigniorage algorithm, falling from its $1 peg to less than $0.01 within months.
With its $1 peg stablecoin ‘Iron’ and free-floating crypto token ‘Titan’, Iron Finance saw a death spiral as large Titan holders dumped their positions to realise profits, causing a wave of retail investors panic selling and a loss of the $1 peg.
There were many other failed attempts, such as SafeCoin, BitUSD, DigitalDollar, NuBits, and CK USD.
Even with these examples, many in the Terra community (who ironically call themselves ‘Lunatics’) would denounce those who raised the possibility of the same occurring to Terra.
This was exemplified by Do Kwon himself, who, after British economist Frances Coppola tweeted that mechanisms such as UST will fail when “panicking investors [begin] stampeding for the exit,” replied that he ‘[doesn’t] debate the poor on Twitter.’
Even during the beginning of the de-peg on May 9, Do Kwon tweeted that “you could listen to CT influensooors about UST de-pegging for the 69th time. Or you could remember they’re all now poor, and go for a run instead. Wyd”.
While Terra had greater development with more use cases for UST than any of the other failed algo-stable concepts (examples including Anchor’s lending protocol, Mirror’s synthetic stock innovation and decentralised exchanges such as Astro-port), the fact remained that the entire project hinged on the maintenance of trust in UST being worth $1.
The attitude of Do Kwon and the community as a whole in dismissing the concerns about UST appears to be a clear risk factor when evaluating the situation after the fact. Any future algo-stable concept will need to be cognisant and humble of the fact that failure can occur at any time.
What’s next for Anchor?
Since the 11th of May, the Anchor discord server has been under ‘lockdown.’ There have been no announcements made and no community chat. Additionally, no future for the protocol has been announced on Twitter, Reddit, or the Terraluna discord server.
As of June 8, proposition 29 to freeze the protocol to ‘protect it from attacks’ has passed a community vote. Going forward, individuals will no longer be able to borrow from Anchor but withdrawals and deposits (without accruing interest) will still be possible.
Reflection and learnings?
Firstly, an investment offering 20% APY must have inherent risks. There is no such thing as an entirely risk-free investment. Individuals need to understand the worst-case scenario that could occur with any position and not invest more than they can afford to lose. In the case of Anchor, this meant to understand the potential risk of a de-peg, the potential signs of an unrecoverable peg, and what action to take in such an event.
In the future, it may be the case that where the market cap of the free-floating cryptocurrency (Luna) is less than that of the asset it is designed to back (UST), the peg should be considered unrecoverable. Investors should then take all steps to exit the position.
Building on this concept, algorithmic stablecoins are vulnerable to attacks and bank runs. Within the space of a week, a perfect storm of factors such as the draining of the curve 3pool, large outflows from Anchor, and a fall in traditional equity markets (the NASDAQ falling 6.43% and S & P 500 4.69% from May 6–12) coalesced into the fall of Luna and UST. Current algorithmic stablecoin designs are not anti-fragile. Black swan events can and do occur. It is important that going forward, an investor carefully considers the risk-return profile offered by algorithmic stablecoins.
It will be fascinating to see how the cryptocurrency markets grow and evolve following the events of the past month. We will sceptically look forward to further stablecoin innovation in the time ahead.
REFERENCES
Defi Llama, Anchor (ANC). <https://defillama.com/protocol/anchor>
Greythorn Research Team, ‘Demystifying Anchor’, Greythorn Asset Management, <https://www.greythorn.com/demystifying-anchor>
Messari, Terra Luna Classic. <https://messari.io/asset/terra-luna-classic>
Pascale Davies, ‘Terra Luna stablecoin collapse explained: Is this the 2008 financial crash moment of cryptocurrency?’, Euronews, <https://www.euronews.com/next/2022/05/12/terra-luna-stablecoin-collapse-is-this-the-2008-financial-crash-moment-of-cryptocurrency>
Sam Kessler, ‘UST Stablecoin Briefly Loses Peg, Luna Drops 10%’, Coindesk, <https://www.coindesk.com/business/2022/05/08/ust-briefly-loses-peg-luna-drops-10/>
Taylor Locke, ‘Did a ‘concerted attack’ cause Terra’s UST to crash below $1? An exec behind the largest stablecoin and experts agree it’s suspicious’, Fortune, <https://fortune.com/2022/05/13/terra-ust-stablecoin-crash-suspicious-potential-attack-george-soros/>
Recovering TradFi Chad, ‘How Terra Recovers: Re-Anchoring Expectations’, Substack. <https://recoveringtradfichad.substack.com/p/how-terra-recovers-re-anchoring-expectations?utm_source=%2Fprofile%2F16097418-recovering-tradfi-chad&utm_medium=reader2&s=r>